
Closed-Loop Temperature Control& Application References
From temperature feedback to cooling actuation,
see process optimization in operating records.
Integrate workpiece detection, infrared measurement, servo valve stations and temperature displays into closed-loop control. Control interfaces, operating trends and reference composition data after application document system operation and support process assessment.
Detection, measurement, actuation and display.
One coordinated process target.
Identify arrival timing
Detect workpiece presence and position to trigger spray switching.
HMD-S8W Hot Metal Detector ↗ 02 / Temperature FeedbackAcquire the actual temperature
High-speed infrared measurement provides feedback for closed-loop regulation.
PLK Infrared Pyrometer ↗ 03 / Cooling executionAdjust cooling water flow
The control system calculates the required adjustment; the valve station executes flow and switching commands.
All-Electric Servo Valve Station ↗ 04 / Site DisplayReadings and limit alerts
Display critical temperatures and use color and flashing to identify abnormal conditions.
SCD Full-Color LED Temperature Display ↗Stabilize the temperature path
Keep cooling adjustments aligned with feedback to reduce overcooling and temperature variation.
Improve product consistency
Adjust cooling against target properties and assess results through finished-product tests.
Validate alloy optimization opportunities
Verify microstructural changes, performance requirements and recipe adjustments together to assess cost improvement.
Billet chemical composition after application.
Review the reference data by product size.
HRB400E · Ø18 mm
Reference composition after application; full Ø12–Ø25 data are listed below.
V: 0.004–0.006% · Ceq: 0.40–0.41%.
HRB400E · Ø6–Ø10 mm
Reference composition after application for the documented wire rod size range.
Si: 0.30–0.40% · Ceq: 0.36–0.39%. No V value is stated in the source.
BOYE reference application data for HRB400E, consistent with the product catalogue, Reference Applications (page 7). Values are reference mass percentages, not matched before-and-after measurements of the same heat.
Expand Full Ø12–Ø25 Bar Composition Reference
Twin high-speed bar lines. The source notes lower composition values for single high-speed bar lines. Diameters are in mm; composition and carbon equivalent are in mass %. Scroll horizontally on small screens.
| Size (mm) | Grade | C % | Si % | Mn % | P % | S % | V % | Ceq % | Speed |
|---|---|---|---|---|---|---|---|---|---|
| Ø12 | HRB400E | 0.24–0.255 | 0.30–0.35 | 0.85–0.90 | ≤0.040 | ≤0.040 | 0.004–0.006 | 0.39–0.40 | 39 m/s |
| Ø14 | HRB400E | 0.24–0.255 | 0.30–0.35 | 0.90–0.95 | ≤0.040 | ≤0.040 | 0.004–0.006 | 0.40–0.41 | 34 m/s |
| Ø16 | HRB400E | 0.24–0.255 | 0.30–0.35 | 0.95–1.00 | ≤0.040 | ≤0.040 | 0.004–0.006 | 0.40–0.41 | 26 m/s |
| Ø18 | HRB400E | 0.24–0.255 | 0.30–0.35 | 0.95–1.00 | ≤0.040 | ≤0.040 | 0.004–0.006 | 0.40–0.41 | 24 m/s |
| Ø20 | HRB400E | 0.24–0.255 | 0.30–0.35 | 0.95–1.00 | ≤0.040 | ≤0.040 | 0.004–0.006 | 0.40–0.41 | 18 m/s |
| Ø22 | HRB400E | 0.24–0.255 | 0.30–0.35 | 1.00–1.05 | ≤0.040 | ≤0.040 | 0.004–0.006 | 0.41–0.42 | 15 m/s |
| Ø25 | HRB400E | 0.24–0.255 | 0.30–0.35 | 1.00–1.05 | ≤0.040 | ≤0.040 | 0.004–0.006 | 0.41–0.42 | 11 m/s |
Expand Full Ø6–Ø10 Wire Rod Composition Reference
High-speed wire rod lines. “/” means no V value is stated; it is not a zero-vanadium guarantee. The source does not list a wire rod speed. Scroll horizontally on small screens.
| Size (mm) | Grade | C % | Si % | Mn % | P % | S % | V % | Ceq % |
|---|---|---|---|---|---|---|---|---|
| Ø6–Ø10 | HRB400E | 0.23–0.25 | 0.30–0.40 | 0.60–0.70 | ≤0.040 | ≤0.040 | / | 0.36–0.39 |
These HRB400E reference data do not imply equivalence to another national steel grade. Assess composition and cooling schedules against steel grade, size, operating conditions and finished-product properties. Cost savings require verified alloy consumption, purchasing prices and production data.
See the control interfaces
and actual operating trends.
Closed-loop system · site control interfaces
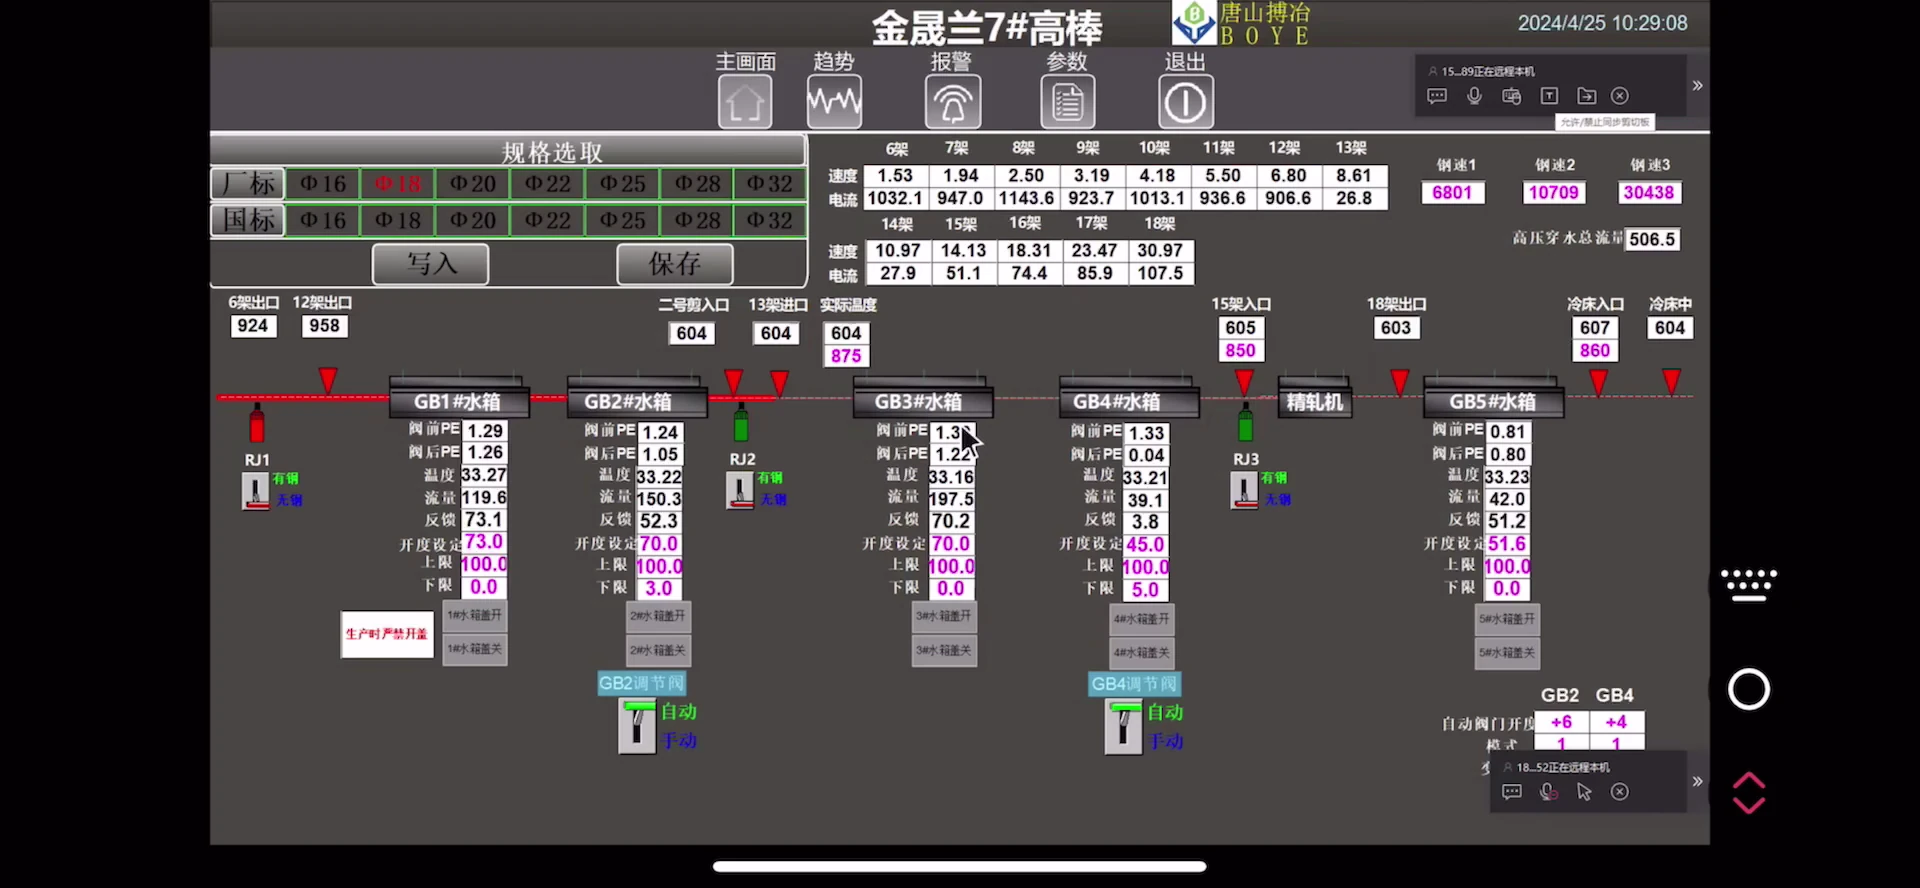
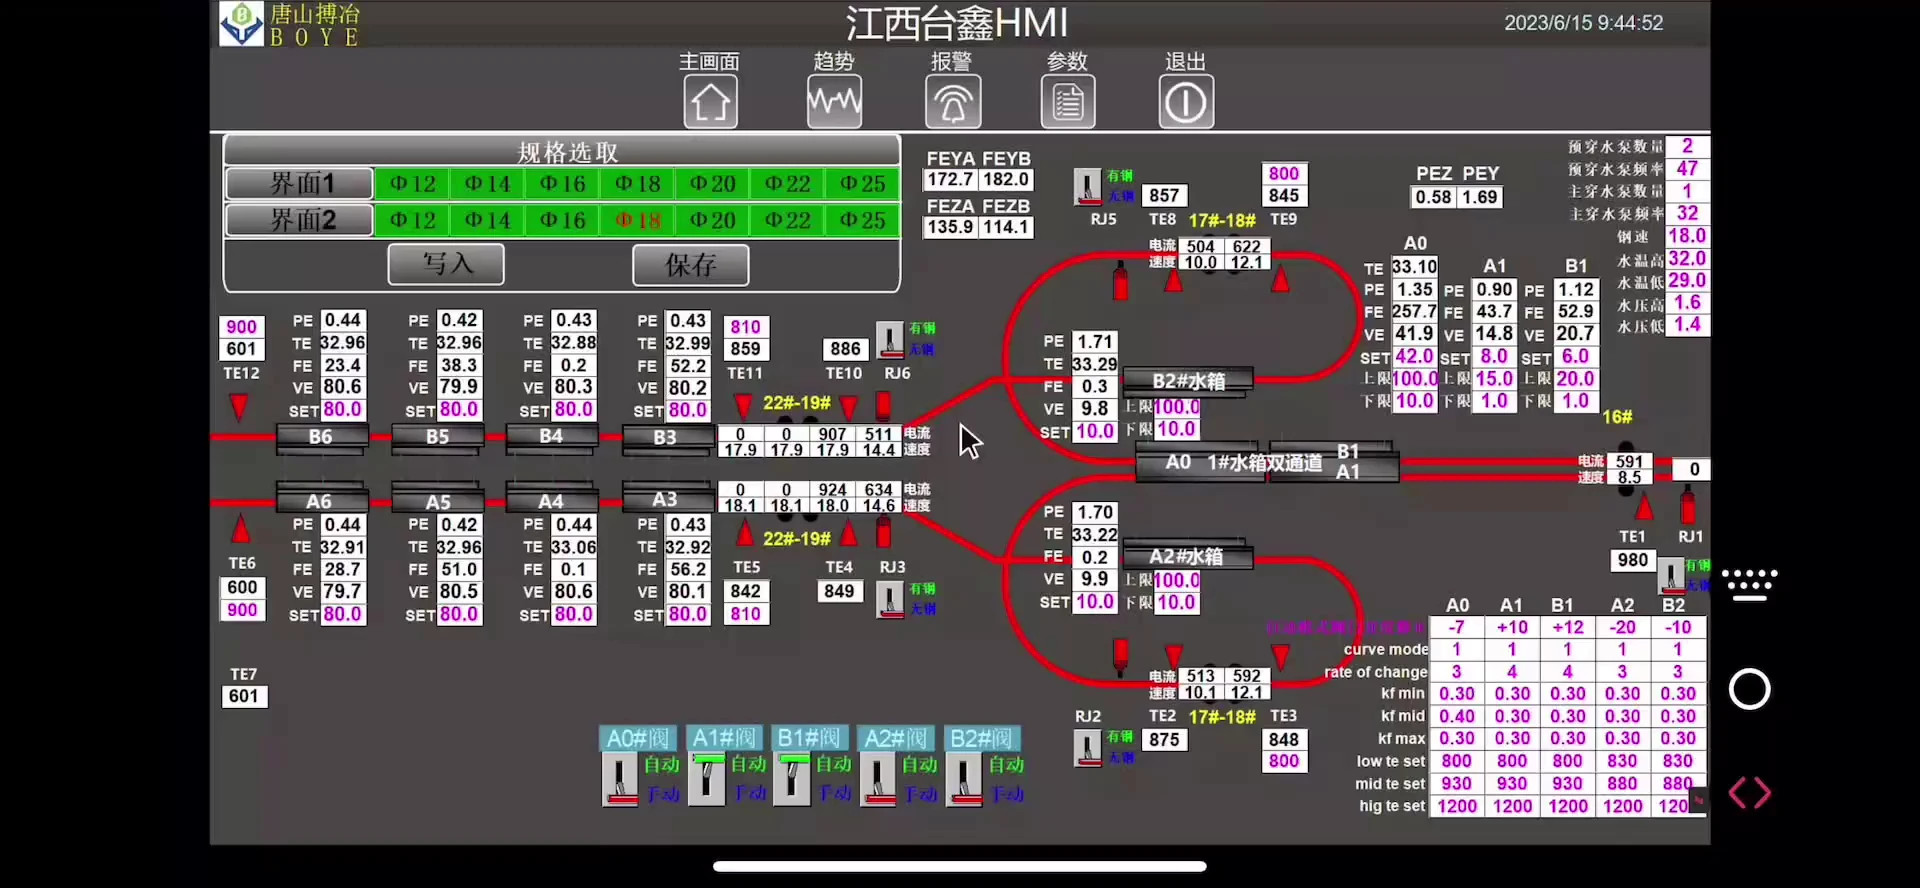
Original interfaces show size selection, valve positions, temperatures and operating status, illustrating site configuration and monitoring.
Closed-loop system · two operating trend records
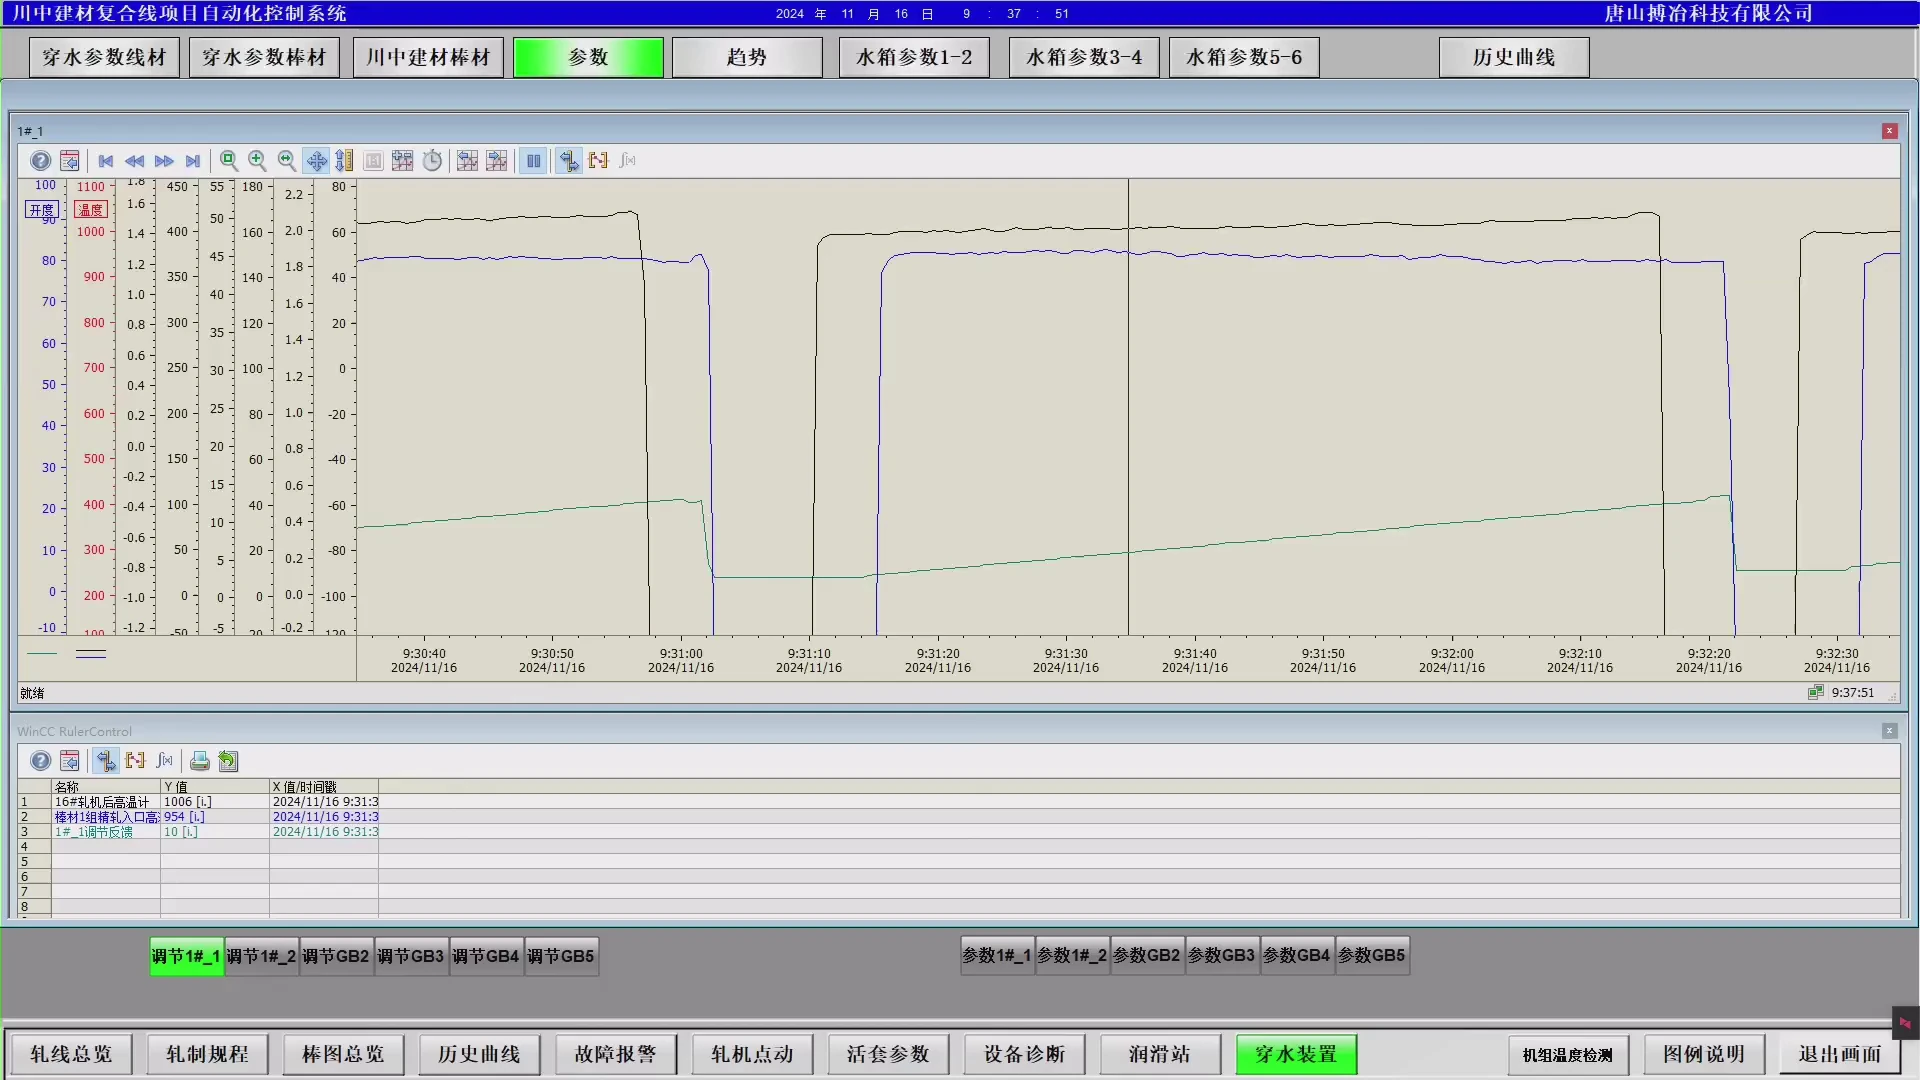
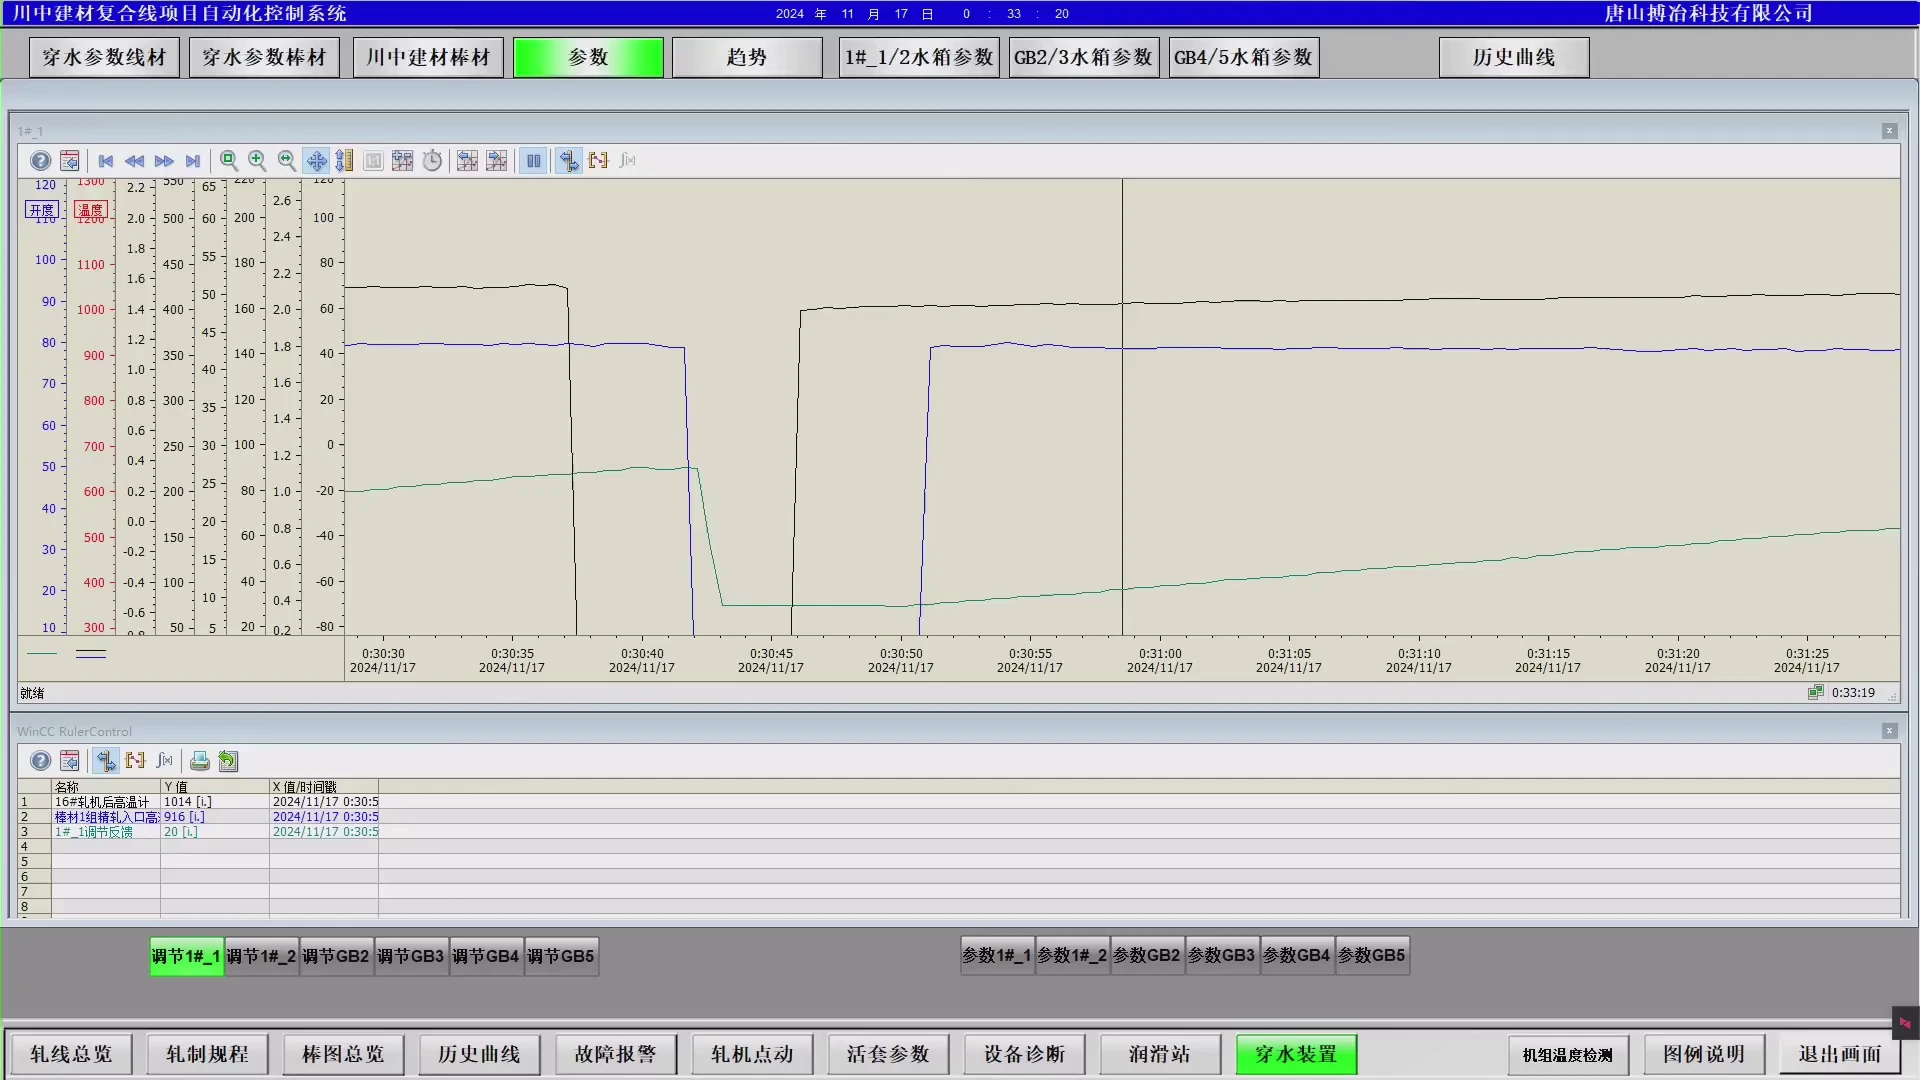
Original trends show operating records. The source does not include a complete trend legend or a matched baseline under the same operating conditions; these charts are not used to calculate savings percentages.
Assess optimization opportunities with your production data.
Share steel grades and sizes, temperature curves, alloy recipes and product performance requirements to plan validation together.